
Assessing Customer Satisfaction in a Performance Management Context Brief
This brief provides practical information to licensing agencies interested in implementing new-licensee opinion surveys as one part of their overall program management activities. It is a condensed and edited version of a paper distributed by the author at the September, 2000 annual CLEAR conference in Miami.
"New-licensee opinion surveys" refers herein to hard-copy questionnaires that solicit from newly licensed persons their satisfaction with important elements of the licensing process and their suggestions for improving the process. Although the paper focuses on licensure, its content extends directly to registration and certification.
In Colorado, Governor Owens strongly emphasizes the importance of increasing citizen satisfaction with governmental programs. This emphasis is current in other states as well. State licensing boards and the regulatory agencies in which they operate are responsive to this priority and expect to be held accountable for their achievement in this regard. They can best demonstrate customer satisfaction if they ask the right questions of the right persons and evaluate the answers in the right way.
Until July, 1999, the Colorado Division of Registrations and the over 30 licensing programs that compose it routinely issued to new licensees a 3.5" x 5.5" card that asked for comments or suggestions for increasing the efficiency and effectiveness of the Division’s licensing programs. The card was sent out with notification of licensure, had the Division’s return address on one side and required no return postage. The Division Director and managers read and reacted as appropriate to these cards.
Comment cards helped spot potential service problems and identified staff members who were remembered as being either more or less helpful. Over time, licensing program elements that were and those that were not well regarded by new licensees were identified. Effective elements were retained and less effective elements were improved. Also, the Division hoped that the cards demonstrated to new licensees that their opinions were valued. At the beginning of its 1998-99 fiscal year, the Division decided to change its comment card survey for a number of reasons:
- It did not reflect the best methods of questionnaire design.
- It was relatively unfocused. It did not inquire into anything specific.
- It did not produce uniform information on particular topics.
- It did not produce objective data, just narrative.
- The Division did not have an efficient way of analyzing, summarizing and reporting the information it received.
- The survey was not developed in the context of the performance management system that the Division had recently established. The information elicited was not focused on measurable performance objectives and standards.
The last point is especially important. From its mission of public protection through effective licensure and enforcement, the Division has derived goals, objectives, critical issues, performance measures, and standards of performance. Here is an example of how these are arranged in relation to one another:
Goal: Communicate effectively to order inform, verify, educate and advise.
Stakeholder issue (from focus group meetings): Provide accurate, sufficient and timely information, using technology as much as possible.
Objective: Enhance the Division’s communication with its customers.
Performance measure: Return 95% of telephone calls from callers who request or require follow-up within 1 business day.
Performance measure: Provide 100% of ‘walk-in’ customers with service within 5 minutes.
Performance measure: Complete and mail license verifications for other states and non-governmental organizations within ten working days of request.
Performance measure: Achieve 150 presentations annually by board and staff members to outside groups and organizations.
Here is another example:
Goal: Identify and license qualified practitioners, facilities, programs, and equipment.
Stakeholder issue (from focus group meetings): Licensing standards must demonstrate a public protection need and should be independent of market-control interests.
Objective: Provide licensing examinations that are relevant to occupational practice and are technically sound. (This includes assuring that tests measure knowledge and skills needed for safe, effective licensee practice and that passing standards are criterion-referenced so that they do not inappropriately manipulate the flow of persons into the marketplace.)
Objective: Maintain high levels of test administration service and test-taker satisfaction.
Performance measure: Assure that all licensing examinations used by the Division are validated and developed in accordance with applicable testing standards.
Performance measure: Assure that at least 95% of licensing examinations are administered under optimal test taking conditions (trained proctors, suitable physical setting, etc.)
Performance measure: Achieve at least 95% candidate satisfaction with examination programs, both state and national.
A new-licensee survey should help support a performance management system by providing information that relates directly to performance measures. Because a regulatory questionnaire must be short if an acceptable response rate is to be achieved and costs are to held low, only a relatively few questions are likely to be asked. Therefore, it is important that they be chosen and constructed carefully. Keeping the goals, stakeholder interests, objectives and performance measures in mind as the questionnaire is developed increases the chances of producing a questionnaire that is useful for program evaluation and management decision making.
- Here are some of the questions that the Division elected to use in relation to the performance measures listed above. These are questions to be asked of persons who have recently completed the licensure process:
- Did Board staff provide you with accurate information?
- Did board staff provide you with sufficient information and instructions to help you complete the steps of the licensing process?
- If you used the Board’s web site, was it useful to you?
- If during the past year you took the XYZ examination, do you believe that it tested knowledge necessary for licensure?
- If during the past year you took the XYZ examination, are you satisfied with how it was administered (test site, personnel, equipment/materials, instructions)?
The Division regards its current new-licensee survey as a tool being used as it is being formed. As a newly adopted approach, opportunities for improving its linkage to the Division’s performance management system (which itself is evolving in content and form) and for improving it in other ways are evident. For this reason, one of the key information fields represented in questionnaire data entry and analysis is questionnaire version number. Toward the end of each fiscal year, the Division will review the utility of the information provided by its questionnaires and will issue appropriately revised versions of them.
The remainder of this paper will address in question-and-answer format some of the technical issues which the Division confronted as it developed its satisfaction assessment program.
Key Issues
Q: Surveying new licensees excludes persons who initiate the licensure application process, but for various reasons do not complete it. Is it not a problem to exclude these persons from the survey?
A: If it is a problem at all, it is probably not a significant one in most licensing settings. It might seem ideal to survey all persons who initiate the application process regardless of whether or not they ever complete it, but it probably would be impractical to do so and might not improve things very much if it were done.
Experience suggests that for most licensing programs, persons who initiate application and pursue licensure with reasonable commitment are eventually licensed. First time passing rates on many examinations are at least 70%. And the passing rate for those who fail and try a second time may be even higher, particularly if their education and training credentials are good. After that, the opposite trend often sets in. If 100 persons take a test that fits this model, then 70 of them pass the first time. Of the thirty that fail, at least 21 pass on the second attempt. That leaves only nine persons from the original group. Even if the third-attempt pass rate is only 45%, that results in four more persons passing, so that only five of the original group of applicants have not met the examination standard. That is not much of an exclusion. And notice that by surveying all new licensees of this hypothetical program, one includes 25 persons who failed the exam at least once. Moreover, many examination programs include opportunities for candidates to record their opinions about the examination immediately after testing. This covers everyone, whether or not they eventually pass.
Of course, examinations are not the only hurdle. Education and experience standards must be satisfied as well. If these standards are at least basically reasonable, probably the vast majority of applicants in most occupations and professional licensing processes will satisfy them, if not on the first document submission then on a subsequent submission. The same reasoning can be applied to persons who are not licensed because of relevant criminal offenses documented in background search reports. And, again, by surveying all new licensees, persons who have had difficulty on the path to satisfying board education, experience and background standards are included.
Q: What are the advantages and disadvantages of free-response (open-ended) survey questions and of objective-response (closed-ended) survey questions? Which should we use?
A: Both kinds of questions have their place in a questionnaire and they usually should supplement one another. For example, in Colorado’s approach, respondents are asked to use an open-ended question to explain dissatisfaction represented in their replies to specific, closed-ended questions. In general, however, the closed-ended format is more useful and efficient than is the open-ended format, at least as far as mail questionnaires are concerned. Some of the important characteristics of these two formats are as follows:
Open-ended Questions:
- Often require little time or effort to compose.
- Useful for inquiries in regard to which the surveyor has little familiarity with the kind and range of opinions held by those to be surveyed.
- Useful to capture information on issues that might have been inadvertently excluded in the remainder of a questionnaire.
- Can be used to explain the reasons for a particular opinion.
- Can require more effort and time to answer than recipients are willing to give.
- Produce information that is often difficult and inefficient to analyze for large numbers of respondents.
- If only one or two open-ended questions can be used, they are likely to be so broad as to produce information that is insufficiently focused.
Often fail to reveal how many respondents hold the view expressed by a few.
Closed-ended Questions:
- Can be relatively well focused on specific issues.
- Allow inquiry about a variety of topics in a short survey.
- Produce uniform information across all respondents.
- Usually do not demand a great deal of effort to answer.
- Information produced is relatively simple to process, analyze and report.
- Can require significant effort to compose (since greater focus demands careful selection of the correct words and phrasing).
- Can be adapted to a variety of informational needs (ranking, expressing how strongly an opinion is held, etc.)
Q: What levels of satisfaction are reasonable to expect? To what standards should we hold ourselves?
A: When it comes to satisfaction, more is often better. However, it is important to keep in mind that regulatory boards frequently must do things to and with people, not just for them. Application fees are required by specified dates in specified form, applications are rejected for incompleteness, money and time must be spent to retake tests that are failed, background investigations must be endured even by the faultless, and so forth. Even a licensing board that is doing its job exactly right will be a source of frustration as well as satisfaction to many people. Some of this will be reflected, directly or indirectly and fairly or not, in responses to customer surveys. Also, experience suggests that the likelihood of responding to a licensing questionnaire might be higher for the dissatisfied than for the satisfied.
Considering all this, it is unreasonable to expect near 100% satisfaction on every topic of inquiry. Questions that involve matters of fact (e.g., Did Board staff provide you with accurate information regarding licensing requirements?) justify higher expectations than more evaluative questions (e.g., those concerning examination content). Across all topics, however, it seems reasonable to expect an overall (average) customer satisfaction standard of about 90%. It also seems reasonable to expect that satisfaction should not fall below 80% on any particular survey item. At least these seem reasonable expectations in connection with the items Colorado is using.
Q: What response rate are we likely to get, assuming a good questionnaire is sent out?
A: Colorado’s pilot study during fiscal 1999-2000 with physicians, physicians assistants, optometrists and barbers/cosmetologists documented about a 30% response rate. More recent rates of return have been substantially lower. Many surveys of other kinds in other settings have exceeded 30%, even without special incentives to reply and without follow-up prompting, and others have fallen short of it. Perhaps about 20%-35% is a realistic target expectation for new-licensee surveys.
Q: Are the opinions of those who respond to our satisfaction questionnaire likely to be representative of all new licensees?
A: This is a key question to which the answer is, unfortunately, that we usually do not know for sure. For most regulatory customer satisfaction surveys, it is infeasible to do the research (e.g., including questions on demographic and personal factors for comparison purposes) that would be necessary to answer this question. In general, the lower the response rate, the more reason there is to worry about representativeness.
The issue might be less of a concern in relation to surveys that gauge only the degree of satisfaction with five to ten program features than in relation to surveys that solicit opinions, preferences and respondent needs in regard to a wide range of subjects. For surveys of the former kind, the main question is simply whether the satisfaction percentages calculated are higher than, lower than, or about right relative to the percentages that would be obtained if the total population were to respond to a questionnaire. If it is true (and experience suggests that it is) that the probability of responding to a satisfaction questionnaire is no higher for persons who are satisfied than for persons who are dissatisfied, then it is a good bet that satisfaction survey results will be about on target or somewhat conservative. In any case, it is always a good idea to try to compare questionnaire results with other sources of information, formal or informal, that are available. Never accept or report customer satisfaction results for a program without first asking whether they make sense to those who are most familiar with administration of the program.
Q: Can we develop a survey program that permits analysis of each separate licensing program while also allowing evaluation of our Division as a whole?
A: Yes. Colorado decided that it wanted customer satisfaction information in relation to each of its licensing programs, consistent with the fact that each program manager and program staff are responsible for specific performance standards. Also, while most programs include many of the same basic service elements, these are manifest somewhat differently across programs. Therefore, program-specific information is essential. On the other hand, the Division also wanted to be able to present a customer satisfaction picture of the Division as a whole.
The solution was to standardize survey questions across programs as much as possible, but to allow certain kinds of variation. For example, one program might include both a national written test and a state practical test. Another might include no state test, but a national and a regional test. A third might not include an examination for which the board has responsibility. Most programs include provision for licensure by endorsement, but some do not. Questionnaire items were written to accommodate such variation, and where appropriate specific words were changed to conform to the usage most common among the respondent group. However, other items – such as those concerning accuracy of information given, courtesy, and one business day response time to voice-mail messages - are the same across programs.
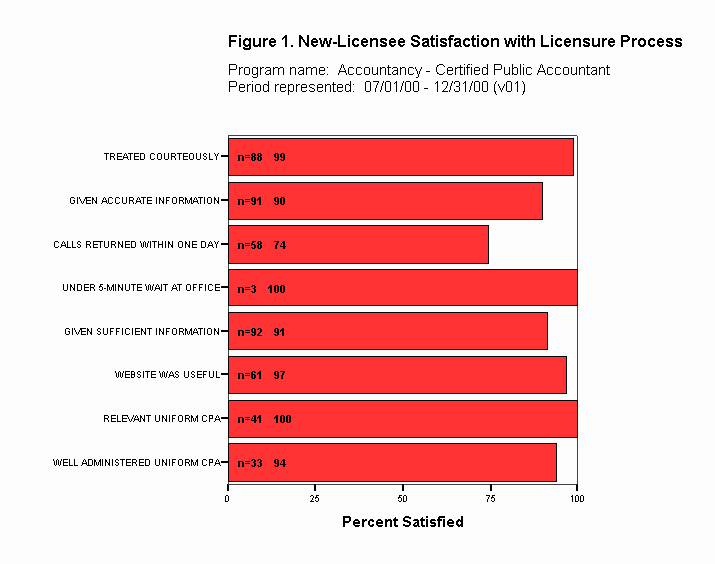
Figure 1 shows a bar chart of results for the Colorado Accountant licensing program during the first six months of the current fiscal year. Appendix A shows the accountant questionnaire.
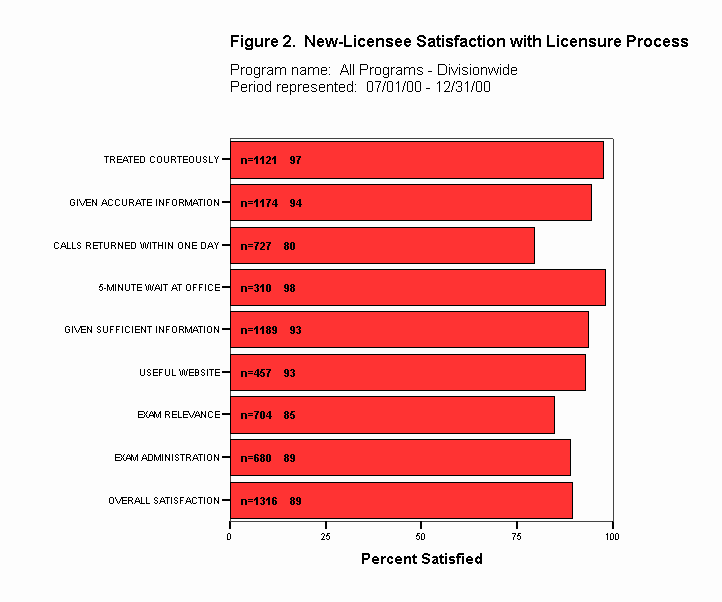
For the division-wide picture, respondent data is combined over all programs. So, for example, there is an overall examination-content satisfaction factor and another overall examination-administration satisfaction factor. Also, these two are combined into a single, overall factor representing satisfaction with examinations. Another feature of the division-wide report is a satisfaction measure combining all questions into an overall licensing-process satisfaction factor. This is the most general indicator. Figure 2 shows the bar graph representing results for the Division during the first six months of the current fiscal year. Because this chart represents many Division programs, the number of replies is much larger than is true for the accountant program by itself.
Q: Should questionnaires be anonymous or should respondents be asked to provide their names so that a manager can follow-up on a particular person’s expressed dissatisfaction with something?
A: There are some obvious advantages to receiving a name to go with a reply. However, the disadvantages of requesting a name probably outweigh the positive side for the kind of opinion survey of interest here. Experience suggests that persons who want to provide their names will do so whether or not they are asked and that asking for names might dampen questionnaire response rate and affect the opinions expressed. Therefore, the Division decided not to ask for names, although all questionnaires inform respondents that they may give their names if they wish to do so.
Q: Q: What are some characteristics of a well designed questionnaire for regulatory boards?
A: Here are a several important features (see footnote 1):
- It attempts to convince respondents that it is worth their time to fill it out and return it.
- What the questionnaire is about and why respondents should fill it out is made clear almost immediately.
- It is respondent-friendly.
- It makes a good first impression and attracts respondents’ interest. It has a good visual impact.
- At its beginning, it has an informative title, perhaps a graphic design appropriate to the survey and the name of the survey’s sponsor.
It is brief and takes only a few minutes to complete and post. - It requires no postage from the respondent.
It is self contained - does not involve a return envelope. - Questions are easy to understand and answer.
- Instructions are clear, simple, brief and located near to where they apply.
- The word "please" is used appropriately in connection with instructions.
- It is composed using effective grammar and composition. Unnecessary bureaucratic terms and bureaucratic style are avoided.
- It uses language the respondent group will understand and terms with which the group is familiar.
- Its layout supports data entry that will be done (and which should be planned ahead of time).
- It does not begin with an open-ended question.
- It somehow captures the date and questionnaire version (to support analyses over time and to take into account changes made to the questionnaire over time).
- It is printed on paper stock heavy enough for the intended method of return (70# stock works well for Colorado’s questionnaires).
It is not cluttered with unnecessary lines, boxes, etc. - It thanks the respondent for the opinion they offer.
Q: How many response options to closed-ended, objective-response questions should we have and what should they be?
A: Different persons have different views on this, and a lot depends on the purpose of the survey. For many regulatory satisfaction surveys, Yes, No, No, and N/A (for "does not apply") probably are sufficient. This simple response format requires respondents to confront the fundamental question of whether they are, overall, satisfied or dissatisfied with the service to which a question refers. It also conserves questionnaire space. Even satisfaction surveys that offer more response options (e.g., ranging from Very Satisfied to Very Dissatisfied) often do or should avoid a mid-point No Opinion option. Such a non-committal response option is likely to serve as an invitation for respondents not to deal with the questions asked. Also, subtle gradations of satisfaction and of dissatisfaction are unlikely to be of practical value for most regulatory questionnaires.
Q: Even if the respondents are representative of all those to whom we mailed a questionnaire, how do we know if our number of replies or our response rate is high enough for us to conclude that the results are acceptably precise?
A: This is a technical matter involving several statistical issues in the area of sampling. Precision is usually measured in terms of a margin of error that applies to the survey results. Appendix B provides a discussion of the pertinent factors and gives a table showing numbers of responses needed for two different margins of error and for programs of various sizes. In relation to surveying new-licensees, the program (population) size will be no larger than the number of persons licensed annually, assuming that the interest is in an annual time frame. One rule-of-thumb is that 200 responses are often sufficient for reasonable precision, regardless of program size or other factors. Another is that if program size is at least 500 and a 30% response rate is attained, a margin of error of +/- 5% will be achieved. Response rates of less than 30% can give reasonable precision as program size increases beyond 500.
It is important to realize that for questionnaire items that include an "if" qualifier, population size is likely to be smaller then the number of persons licensed (the number of questionnaires mailed). For example, item 6 of the Colorado accountant questionnaire (Appendix A) asks: If you telephoned the Board office and left a message requesting a return call, did someone call you back within one business day? The population relevant to this item is only those new licensees who, as applicants, called and requested a return. Whatever this number is, it is smaller than the total number of persons licensed.
Finally, respondent group size is only those person who answer a question either Yes or No. Respondents who skip a question or who mark N/A are not part of the respondent group, at least not for the purpose of calculating the percentage of persons satisfied with the program element represented by a questionnaire item. This is true whether or not an item includes an "if" qualifier.
Q: How much does it cost to implement such a program and to keep it going? What dollar and human resources are needed?
A: Here is the current fiscal-year budget for Colorado’s approach:
Paper stock, printing, folding: 19,860 sheets on 70# stock, both white and color; printed on both sides and including the return postage symbol; folded to fit in outgoing mail (like a business letter included with the new license): $1,355
Return postage assuming a 35% response rate: $2,572.
Key entry work assuming a 35% response rate: $285.
Total: $4,212.
The Division does not mail questionnaires independently of other mailings to new licensees. Questionnaires are designed to be brief enough for business-letter folding and inclusion with mail that is routinely sent.
The above costs exclude significant staff time involved in planning and designing the survey. Also excluded is the in-house programming to edit and analyze key-entered data and to produce reports and graphics. The excluded costs are, of course, largely non-recurring. Once the analytical software is developed, it need only be maintained and modified from time to time.
The figures above imply that it costs the Division 21 cents per new license issued (approximately 20,000 annually) to gauge the satisfaction of new licensees with the Division’s licensing process, both in the aggregate and on a program-specific basis.
Q: How should the completed questionnaires be converted into a data file for analysis?
A: Questionnaires can be designed and printed so that they can be scanned either by an optical mark reader or by another kind of scanner. Alternatively, the information can be key entered. Colorado decided on key entry because it is so inexpensive ($.0024 per key stroke), involves the Division in less bureaucracy than scanning, is quite accurate and easily error-checked by the programming that performs the data analyses, and is accomplished with short turn-around time (usually one day for a batch of about 150 questionnaires). The decision was made not to have the data verified by second, independent entry. That would double data entry costs. Further, the Division’s experience checking the data files produced during the fiscal year 1999-2000 pilot phase showed an almost nonexistent key-entry error rate. Since this is customer satisfaction data to be analyzed and reported in summary form, and not test scores or other personal data concerning individuals, it makes sense to pay for key-entry only.
Q: How often should data be reported? Who should get what reports?
A: Colorado decided to report twice annually, at the middle and the end of the fiscal year. It seems doubtful that satisfaction data feedback is needed more frequently than this. Each program administrator will receive a report on each of his/her programs and will also receive the report representing the Division as a whole. The Division Director will receive all reports.
Q: Who should have active input to decisions about questionnaire content and format?
A: Development of questionnaires of various kinds is too often delegated to one or two persons only. These persons might not have direct accountability for the performance measures reflected in a questionnaire. They might have familiarity with one or two licensing programs, but lack information on how the many programs of a centralized regulatory agency vary in important ways from one another. Also, they might not have much experience creating questionnaires that reflect good survey practice. Probably, they would pass their proposed product by others before making it final.
This is not a good way to proceed. It is important that all managers who will be affected by survey results be involved directly and actively in all stages of the questionnaire development process. Of course, the person formally responsible for the effort will identify issues for others to address and will lead in other respects as well. However, one or two persons are unlikely to anticipate and have the best answers to all of the important issues that should be consider during project planning.
Q: How important is it to pre-test the program, and how might that be done?
Even with a sound approach to survey development, it is important to pre-test a questionnaire. Like examination questions thought by those who carefully write and edit them to be without significant shortcomings, questionnaire items often do not work exactly as their authors expect. Colorado started out fiscal year 1999-2000 with four pilot licensing programs. Not only did this allow pre-testing of the questionnaires, but it also pointed up the need for changes in the software used to analyze and report the data. All programs benefited from the experience as the Division implemented fully for all of its 33 programs at the beginning of fiscal 2000-2001.
The confidence you have in the replies you receive to a customer satisfaction survey question is determined by a number of factors, both statistical and nonstatistical. Statistical factors include population size, respondent group size and the amount of variation in the population with regard to the question asked. With relatively small populations, high response rates (the ratio of number of responses to population size) are needed if survey results are to be precise. However, once population size exceeds about 400, response rates as low as 20% can yield acceptable precision. And about 200 responses can be sufficient for acceptable precision, regardless of population size. Response numbers in excess of 200 will bring additional precision, but at a decreasing rate. Of course, larger sample sizes might be desirable for several reasons.
The degree of variability of opinion in the population also plays an important role in determining the number of responses necessary. If we know that every member of a population thinks exactly alike on a topic represented by a particular survey question (for example, either they are all satisfied or all dissatisfied with a particular service), a single reply is sufficient and has no margin of error. As the opinions of the population become more varied on the question of interest, larger numbers of replies to the question are needed for an acceptable margin of error. It is often a good idea when planning survey efforts to assume high rather than low variability.
If survey respondents are to be broken down into subgroups and if we want acceptable margins of error to apply to the results from each subgroup, the sizes of these subgroups become important. Total respondent-group survey results might be acceptably precise, but the results for one or more subgroups of interest might not be. For example, customer satisfaction results for an entire regulatory division comprising many licensing programs might be acceptably precise, but the results concerning a single licensing program within that division may or may not be.
The table below is intended to be of use in situations where population size is not large and, therefore, the ratio of replies to population is important. This is likely to be the case in relation to many individual licensing boards. For a given population size, the table gives the minimal number of replies necessary for two different margins of error: 5 percentage points and 7 percentage points. The table should be used in connection with the discussion of population size and respondent group size in the main body of this paper.
In column 1 find the number of persons in your population of interest. The corresponding entry in column 2 is the number of replies you will need in order to have 85% confidence that the percentage of respondents who replied favorably is accurate within a +/- 7 percentage point margin of error. The corresponding entry in column 3 is the number of replies you will need in order to have 85% confidence that the percentage of respondents who replied favorably is accurate within a +/- 5 percentage point margin of error. If you survey fewer persons than the entire population of interest (i.e., if you sample), it is still the larger population number, and not the size of the sample to which you send questionnaires, that you should reference in column 1.
The values in the table assume that replies represent a random selection of all possible replies. This assumption is seldom, if ever, satisfied in practice. Therefore, the numbers in columns 2 and 3 of the table and the 85% confidence interpretation should be regarded as "soft" (but not arbitrary) guidelines for administrative research. They are not scientific criteria. On the other hand, the table reflects another assumption (that the variation of opinion in the surveyed population is at its maximum) that makes the table conservative. In other words, the numbers of required replies are somewhat higher than you might need in order to achieve the margins of error represent by columns 2 and 3.
A response rate of at least 20% is not uncommon (though by no means assured) for well designed survey efforts. Notice that, for the +/- 7 percentage point margin of error (column 2), this rate is represented in the row for a population size of 400 and replies equal to 84 (84/400=.21). Response rates represented below this row of the table are 20% or less, and response rates represented above this row exceed 20%. This are useful facts, since they imply that (a) we are reasonably likely to achieve a +/- 7 percentage point margin of error if we survey everyone in our population of interest and if that population consists of at least 400 persons and (b) as our population size increases beyond 400, a 20% response rate will result in a margin of error even less than 7 percentage points. Also, for populations greater than 400, survey efforts that fail to achieve response rates as high as 20% might nevertheless produce acceptable margins of error. The same reasoning applies to the interpretation and implications of column 3.
And remember, when determining margins of error, the number of replies is the number of persons who answer a given question, not the number of questionnaires returned. It is seldom the case that each respondent answers every question.
Population Replies Needed Replies Needed
Size For +/- .07 For +/- .05
10 9 -0-
20 17 18
30 24 26
40 29 34
50 34 40
60 38 47
70 42 53
80 46 58
90 49 63
100 52 68
110 54 68
120 56 76
130 58 80
140 60 84
150 62 87
160 64 91
170 65 94
180 67 97
190 68 100
200 69 102
220 72 107
240 74 112
260 75 116
280 77 120
300 79 124
320 80 124
340 81 130
360 82 133
380 83 135
400 84 138
420 85 140
440 86 142
460 87 144
480 87 146
500 88 148
520 88 150
540 89 152
560 90 153
580 90 155
600 91 156
650 92 159
700 93 162
750 93 165
800 94 167
850 95 169
900 95 171
950 96 173
1000 96 174
1100 97 177
1200 98 179
Population Replies Needed Replies Needed
Size For +/- .07 For +/- .05
1300 99 181
1400 99 183
1500 100 185
1600 100 185
1700 100 188
1800 101 189
1900 101 190
2000 101 191
Click here for Appendix 1
COPYRIGHT 2000. Rights to copy and distribute this publication are hereby granted to members of the Council on Licensure, Enforcement and Regulation (CLEAR), providing credit is given to CLEAR and copies are not distributed for profit.